您现在的位置是:网站首页> 编程资料编程资料
如何使用Python修改matplotlib.pyplot.colorbar的位置以对齐主图_python_
![]() 2023-05-26
543人已围观
2023-05-26
543人已围观
简介 如何使用Python修改matplotlib.pyplot.colorbar的位置以对齐主图_python_
问题描述
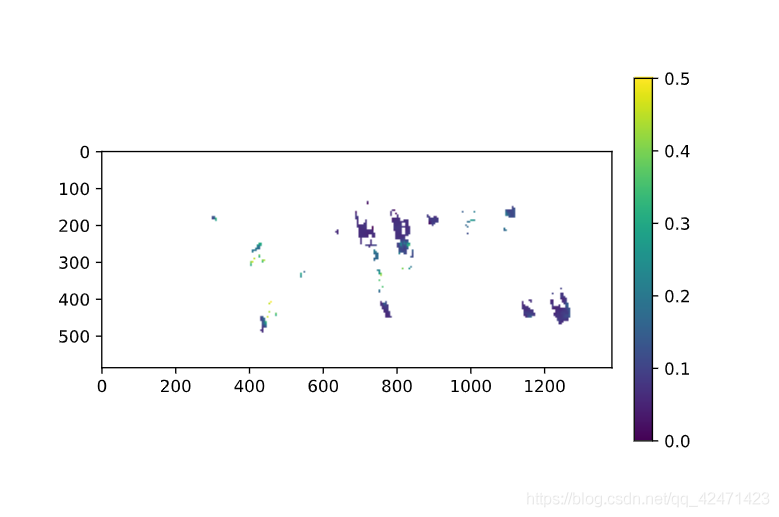
像这样的图,我想把右边的colorbar设置成和主图一样高度
方法
0. plt.colorbar参数介绍
1. plt.colorbar(im, fraction=0.046, pad=0.04, shrink=1.0)
fraction可以从0.035-0.046调节以找到合适大小
但当图像的长、高对比过大时,可能不起作用
2. make_axes_locatable
这是matplotlib包里的一个函数
from mpl_toolkits.axes_grid1 import make_axes_locatable im = plt.imshow(data) divider = make_axes_locatable(plt.gca()) cax = divider.append_axes("right", size="5%", pad="3%") plt.colorbar(im, cax=cax) 不适用于有投影参数的axe(会报错),如cartopy的GeoAxes
3. make_axes_locatables 升级版
https://stackoverflow.com/questions/18195758/set-matplotlib-colorbar-size-to-match-graph @Matthias
import matplotlib.pyplot as plt from mpl_toolkits import axes_grid1 def add_colorbar(im, aspect=20, pad_fraction=0.5, **kwargs): """Add a vertical color bar to an image plot.""" divider = axes_grid1.make_axes_locatable(im.axes) width = axes_grid1.axes_size.AxesY(im.axes, aspect=1./aspect) pad = axes_grid1.axes_size.Fraction(pad_fraction, width) current_ax = plt.gca() cax = divider.append_axes("right", size=width, pad=pad) plt.sca(current_ax) return im.axes.figure.colorbar(im, cax=cax, **kwargs) 用法示例
im = plt.imshow(np.arange(200).reshape((20, 10))) add_colorbar(im)
4. 手动给colorbar添加一个axe
https://stackoverflow.com/questions/18195758/set-matplotlib-colorbar-size-to-match-graph @Fei Yao
import matplotlib.pyplot as plt import numpy as np fig=plt.figure() ax = plt.axes() im = ax.imshow(np.arange(100).reshape((10,10))) # Create an axes for colorbar. The position of the axes is calculated based on the position of ax. # You can change 0.01 to adjust the distance between the main image and the colorbar. # You can change 0.02 to adjust the width of the colorbar. # This practice is universal for both subplots and GeoAxes. cax = fig.add_axes([ax.get_position().x1+0.01,ax.get_position().y0,0.02,ax.get_position().height]) plt.colorbar(im, cax=cax) # Similar to fig.colorbar(im, cax = cax)
效果展示

总结
到此这篇关于如何使用Python修改matplotlib.pyplot.colorbar的位置以对齐主图的文章就介绍到这了,更多相关Python修改matplotlib.pyplot.colorbar位置内容请搜索以前的文章或继续浏览下面的相关文章希望大家以后多多支持!
您可能感兴趣的文章:
相关内容
- Python中如何使用Matplotlib库绘制图形_python_
- PyCharm调用matplotlib绘图时图像弹出问题详解_python_
- 盘点Python 爬虫中的常见加密算法_python_
- python多线程死锁现象及解决方法_python_
- 十个Python中常用的pip命令总结_python_
- Python异步发送日志到远程服务器详情_python_
- 利用Python实现一键将头像转成动漫风_python_
- python 数据保存为npy和npz格式并读取的完整代码_python_
- Django使用mysqlclient服务连接并写入数据库的操作过程_python_
- Python正则表达式re模块详解(建议收藏!)_python_